
SIGN UP for Trade Ideas, Tools, & Training ↑
THE OPTIONSGEEK FRAMEWORK
How to Know If an Option Is Worth Buying
Why traditional options metrics can miss what matters most — and how comparing your stock-price target with market expectations can reveal value.
Every investment decision begins with a comparison. An investor looks at the price of an asset, forms an opinion about what that asset could be worth, and decides whether the difference creates an attractive opportunity. Whether someone is analyzing a stock, a bond, a business, or a piece of real estate, price means very little without something meaningful to compare it against.
Options are no different.
The options industry has always understood the importance of comparison, but the comparisons traditionally taught to investors come largely from the world of professional volatility trading.
Investors learn to compare:
• Implied volatility with historical volatility
• Current implied volatility with its historical range
• Volatility across strikes
• Volatility across expirations
• Implied volatility with realized volatility
Those are valid comparisons, and for a volatility trader they are exactly the right questions.
This is not a fringe part of options education. The Options Industry Council describes implied and historical volatility as central to option valuation and risk management, and teaches standard deviation as a foundational framework for translating volatility into expected price movement.
The problem is that this framework can create confusion for the directional investor, who is trying to answer a different question.
The OptionsGeek framework, developed by Felix Frey, starts with a more direct and logical comparison: the investor’s forward-looking stock expectation versus what the options market is pricing.
That sounds simple once it is stated. Getting both sides into a form that can actually be compared is the harder part.
Why Volatility Traders Compare Volatility
Professional volatility traders are engaged in a relative-value exercise. They are looking for places where volatility appears cheap or expensive relative to another measure of volatility.
They may compare:
● Implied volatility with realized volatility
● One strike with another through skew
● One expiration with another through term structure
● A security with another
● Today's implied volatility with its own historical range
The common thread is simple: they are comparing volatility with volatility because volatility is what they are trading.
Once a relative-value opportunity is identified, the Greeks become central to extracting and managing the P/L. Delta may be hedged repeatedly so that the trader can isolate other exposures. Gamma and theta can be managed against one another. Vega measures exposure to changes in implied volatility. Skew and term structure can themselves become the subject of the trade.
This framework makes perfect sense for a professional volatility trader. The problem is not that the framework is wrong. The problem is that much of options education applies the same starting framework to investors who are not playing that game.
My estimate is that the overwhelming majority of investors using options, perhaps 99%, are ultimately making some form of directional decision. They believe a stock, index, or ETF is going higher, lower, or remaining above or below a particular level. Even many investors who describe themselves as volatility traders are really using volatility statistics as an input into a directional or range-based trade.
Looking at IV Rank and deciding to sell a put spread because implied volatility is high is not the same activity as professionally trading relative volatility while dynamically managing the underlying exposures.
The distinction matters because the two investors are trying to answer different questions.
Historical Volatility Looks in the Wrong Direction
Historical volatility is useful because it tells us how much a stock has moved in the past. It can establish a baseline and provide context for whether current conditions look unusual. I use historical volatility myself for exactly that reason.
But for a directional investor, that creates an obvious limitation: the investment thesis is about the future, and sometimes the future bears little resemblance to the historical period being measured.
Consider a biotechnology company approaching an important FDA decision. Suppose the company has not faced a comparable regulatory event in ten years. An investor can calculate the stock's realized volatility over the previous 30 days, 90 days, one year, or several years with great precision. The calculation may be completely accurate, but the underlying sample may contain nothing resembling the event the investor is trying to evaluate today.
This exposes an important limitation of historical comparisons.
Historical volatility can describe the past very well without providing an adequate benchmark for a unique forward-looking catalyst.
If the reason for the investment exists in the future and did not exist in the historical sample, comparing today's opportunity primarily with yesterday's movement can point the investor toward the wrong conclusion.
Historical volatility is therefore useful context, but it should not be the foundational comparison for a directional investor. The comparison has to look forward.
Implied Volatility Looks Forward, But It Does Not Look in a Direction
Implied volatility solves part of the problem because it is forward-looking. Option prices reflect what the market is currently charging for future uncertainty, so implied volatility contains information about the range of outcomes the market is pricing today rather than simply describing what happened in the past.
For a directional investor, however, another problem remains.
Implied volatility measures expected dispersion. It helps describe how wide the market believes the range of possible future outcomes may be, but it does not tell the investor which directional outcome represents attractive value.
This underlying fact is well established.
The Options Industry Council describes implied volatility as a measure of the magnitude of expected movement, not its direction, and separately describes relative-value approaches that compare forward-looking implied volatility with backward-looking delivered volatility.
Suppose a stock is trading at $100 and, after completing the research, an investor believes the stock could reasonably reach $150 over the relevant timeframe. The investor is not trying to evaluate the full range of possible outcomes. Instead, they have a thesis focused on a specific directional move and want to know whether the options market is underestimating that possibility.
This is the key distinction.
Historical volatility is backward-looking and non-directional. Implied volatility is forward-looking but still non-directional.
The directional investor needs a comparison that is both forward-looking and directional.
DIRECTIONAL INVESTOR NEEDS:
✓ Forward-looking
✓ Directional
HISTORICAL VOLATILITY
✕ Backward-looking
✕ Non-Directional
IMPLIED VOLATILITY
✓ Forward-looking
✕ Non-Directional
That requires putting the investor's view and the market's view into comparable terms.
The Investor Already Has One Side of the Comparison
Directional investors naturally think in stock prices. An analyst may believe a company is worth $75. A portfolio manager may believe a stock trading at $90 can reach $125. An investor may expect a specific catalyst to move a stock from $50 to $70.
In other words, the investor already has a language for expressing expectations. It is usually some combination of a target stock price, a timeframe, a catalyst, and a degree of confidence.
That gives us one side of the comparison: the investor's price expectation.
The harder part is understanding the other side. What is the options market expecting, and how can that expectation be expressed in a form that can actually be compared with the investor's target?
This is where traditional options education becomes difficult for the directional investor. Open a conventional options chain and the investor is presented with implied volatility, delta, gamma, theta, vega, bid, ask, volume, open interest, and option premiums.
TRADITIONAL OPTIONS CHAIN
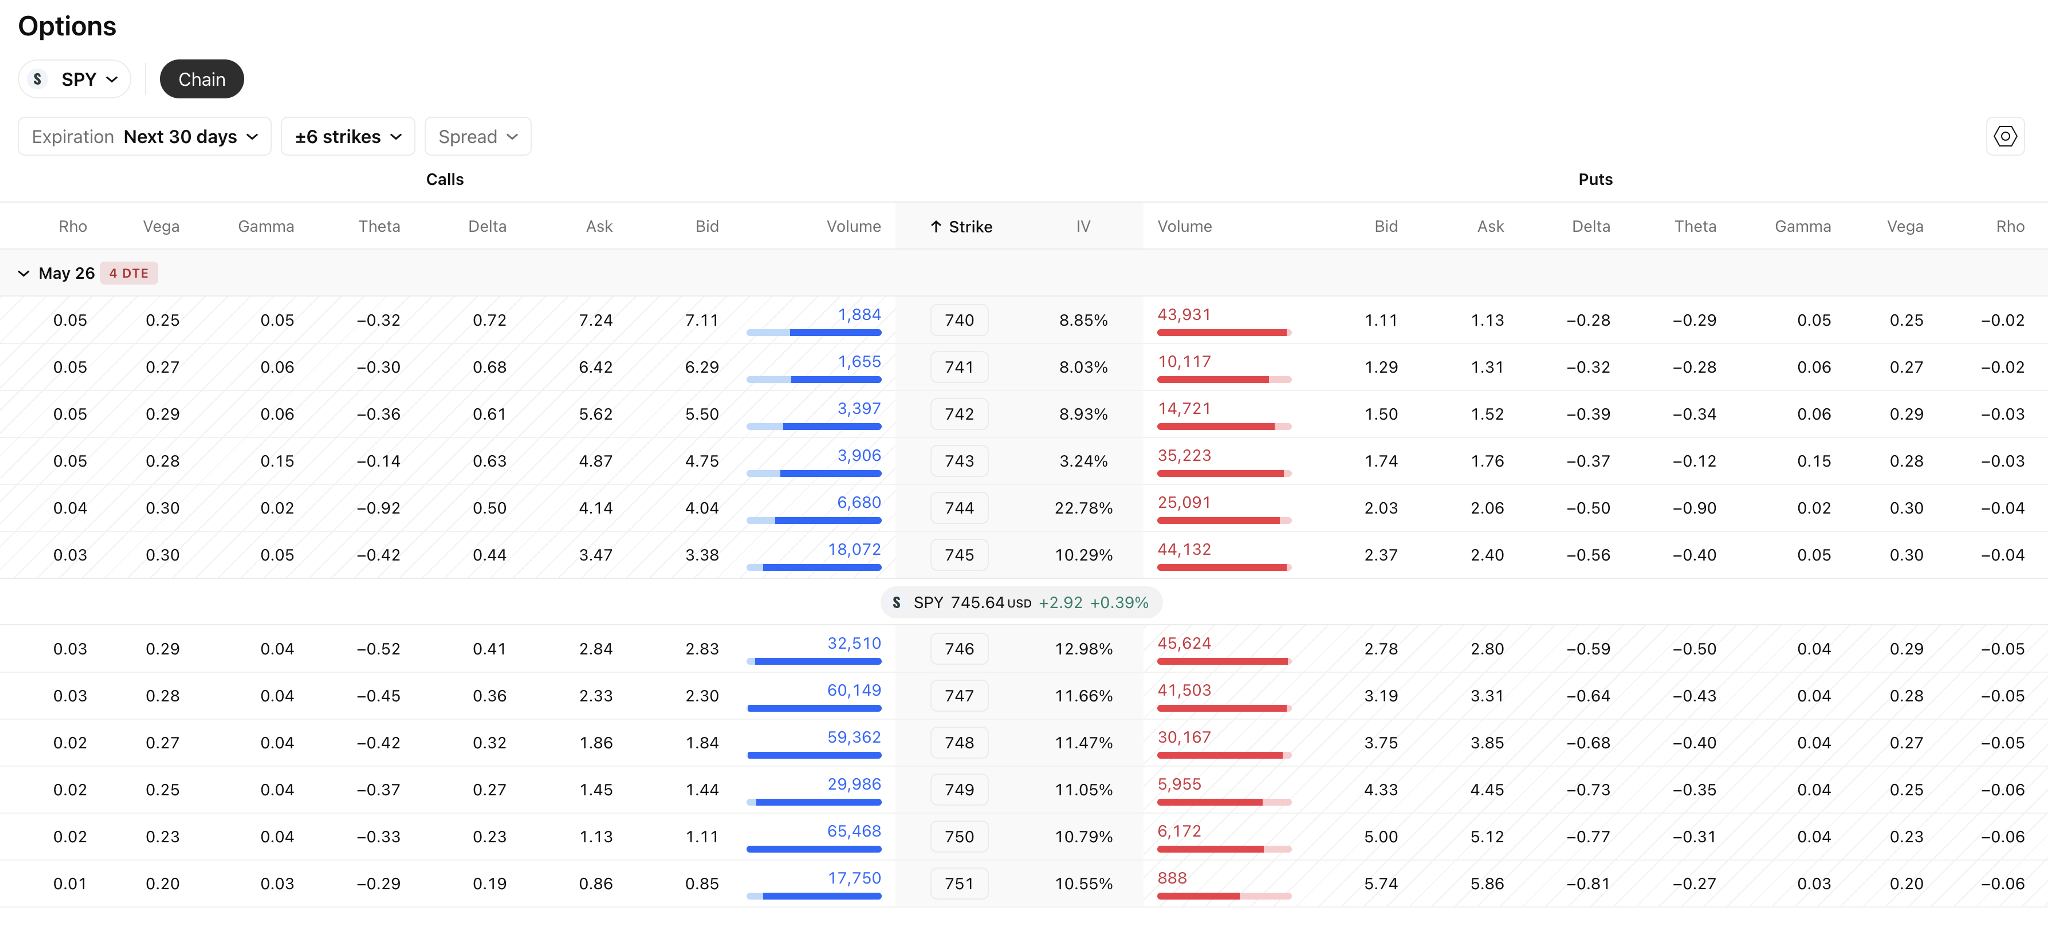
Those numbers contain enormous amounts of information about the option market, but they are not expressed in the same language as the investor's thesis.
An investor says, "I think this stock can reach $150."
The options market answers with an option price, an implied volatility, a delta, and a collection of other measurements.
The two sides do not naturally speak the same language.
Translating the Options Market Into a Price Expectation
This became one of the central problems I wanted to solve at OptionsGeek.
The investor's side was already understandable. If an investor believes a $100 stock can reach $150 within a certain timeframe, we know what the investor expects. The missing piece was translating the options market's pricing into a price expectation that could be compared directly with the investor's price expectation.
That is why I created the Risk-Reward Breakeven Price (RR$), a way to translate the options market's pricing into a stock-price level that can be compared directly with the investor's Target Stock Price.
STOCK PRICE($)
→
STRIKE PRICE ($)
→
MARKET EXPECTATION
RR$
←
INVESTOR EXPECTATION
TARGET STOCK PRICE ($)
→
Once both sides are expressed in comparable terms, the analysis becomes much more intuitive.
The question is no longer simply whether implied volatility is high or low relative to history. Instead, the investor can ask whether the outcome he or she expects is meaningfully different from the outcome reflected in the option premium.
That's the comparison that matters to a directional investor.
If the investor's expectation is close to what the market is already pricing, there may be little advantage. If the investor's expectation is meaningfully different, and the research provides sufficient confidence in that view, the difference may represent an asymmetric opportunity.
This is where the search for Edge begins.
The important insight is not that investors should have price targets. Investors have always had price targets. The difficult part is translating the options market into a comparable price expectation so that the investor can finally place both views side by side.
Why "Cheap Volatility" and "Attractive Directional Value" Are Different Ideas
This distinction also changes what the word cheap means.
In traditional options language, someone may say that implied volatility is cheap because it is below historical volatility, below realized volatility, or near the bottom of its historical range. That can be an entirely valid statement about the relative price of volatility.
But it does not necessarily mean the option offers attractive value to a directional investor.
Imagine implied volatility is historically low, but the investor's research suggests the stock has little realistic upside from its current price. The fact that volatility looks inexpensive does not create a compelling directional opportunity by itself.
The opposite can also be true. Implied volatility may be extremely high. An IV of 80, for example, tells the investor that the market is already charging a great deal for uncertainty. That should give a directional buyer pause. It raises the hurdle and should force the investor to examine the thesis more carefully:
● the realism of the target
● the strength of the catalyst
● the level of confidence
● whether the potential payoff justifies the price being charged
This is why I think of implied volatility as a barometer. It helps me understand the environment I am entering. High implied volatility tells me to sharpen my pencil. Low implied volatility tells me something different about the pricing environment. But neither observation replaces the central directional comparison.
IV provides context. The investor's expectations still have to be compared with the market's expectations.
Where the Greeks Fit
The Greeks occupy a similar place in the directional framework. They are extremely important to professional volatility traders because the exposures represented by delta, gamma, theta, and vega may be the very things those traders are trying to isolate, hedge, or monetize.
For a directional investor, the Greeks are primarily descriptive.
Delta tells the investor how sensitive an option currently is to a small change in the stock price. Gamma describes how that delta may change. Theta helps describe the effect of passing time, while vega describes sensitivity to changes in implied volatility.
That description is consistent with the industry's own definitions. Cboe defines the Greeks as sensitivity measures that indicate how an option's price is expected to change as variables such as the underlying stock price, time to expiration, implied volatility, and interest rates change.
All of that may be interesting information, but it still does not answer the core valuation question.
Suppose one call has a delta of .60 and another has a delta of .40. It is true that the .60-delta option currently behaves more like the stock. But that observation alone cannot tell the investor which option offers the better risk-reward relative to a $150 target. One strike may provide more stock exposure while another may offer substantially better leverage or a more attractive relationship between price and potential payoff.
The same problem arises when investors are taught to compare small differences in gamma or other Greeks across strikes. Those measurements describe the options accurately, but the important question for a directional investor is whether those differences actually change the investment decision.
Delta can describe the exposure you are buying. It cannot tell you whether you are getting a good deal on that exposure.
To answer that question, the option must be evaluated against the investor's directional expectation.
The Question I Kept Waiting to Hear on Wall Street
I began noticing this disconnect while working on Wall Street.
I could call an options salesperson at a major investment bank and ask, "How should I play this stock?" The response would often be immediate and technically sophisticated. We might discuss skew, implied volatility, historical volatility, gamma, vega, different strikes, or different option structures.
What repeatedly struck me was the question that often did not come first:
"What do you think the stock is going to do?"
That seemed backwards to me. How could anyone determine the best way to express my directional investment idea without first understanding my idea?
If I then explained that I believed the stock could double, the analysis immediately changed. The appropriate strike might change, along with the structure and the attractiveness of paying a particular premium.
The reaction was effectively, "Oh, in that case..."
That experience reinforced something I had been thinking about for years. The investor's expectation was not a secondary input. It was one of the fundamental pieces required to interpret the options market in the first place.
A Real-World Example: IV Crush
Earnings show why this distinction matters. Traditional options education often focuses on the post-event drop in implied volatility, or IV Crush, which can scare investors away from buying options altogether. The OptionsGeek Framework starts with a different question: does the expected stock move justify the premium being paid?
METRIC / SCENARIO
HOW THE OPTIONSGEEK FRAMEWORK HANDLES IT
The Traditional View
Avoid buying before earnings because the post-event volatility drop destroys premium.
The OptionsGeek View
If the stock moves sufficiently beyond your Risk-Reward Breakeven Price (RR$), the intrinsic value created by the move should outweigh the decline in implied volatility.
The Strategic Focus
Instead of fearing the "crush," you focus entirely on whether the potential payoff (if your target is hit) mathematically justifies the fixed premium you are risking up front.
To see how this fits into the broader decision of when options should be used instead of stock, read Options vs Stock.
A Different Starting Comparison
None of this means that implied volatility, historical volatility, or the Greeks should be ignored. They remain useful tools, and for volatility traders they are indispensable.
The question is where they belong in the decision process.
For a directional investor, the starting point should be the investment thesis. What does the investor believe the stock can do, over what timeframe, and with what degree of confidence? Once that expectation exists, the next challenge is to understand what price expectation is embedded in the options market.
Only then can the investor make the comparison that matters:
Investor Price Expectation vs. Options Market Price Expectation
That comparison is forward-looking on both sides. It is also directional, because it places the investor's specific stock-price thesis against what the market is charging for the relevant outcome.
Volatility traders compare volatility with volatility because volatility is what they trade. Directional investors need a different framework because they are trying to identify whether the market is underestimating a particular directional outcome.
The investor already knows how to express one side of that comparison.
The real challenge is translating the options market into the other.
That is the foundation of the OptionsGeek approach.
Explore the OptionsGeek Framework

Information contained in any email and this website maintained by OptionsGeek, LLC (“OptionsGeek”) are provided for educational purposes only and are neither an offer nor a recommendation to buy or sell any security, options on equities or indices, or cryptocurrency. OptionsGeek and its affiliates may hold a position in any of the companies mentioned. OptionsGeek is neither a registered investment adviser nor a broker-dealer and does not provide customized or personalized recommendations. Any one-on-one coaching or similar products or services offered by or through OptionsGeek does not provide or constitute personal advice, does not take into consideration and is not based on the unique or specific needs, objectives or financial circumstances of any person, and is intended for educational purposes only. Past performance is not necessarily indicative of future results. No trading strategy is risk free. Trading and investing involve substantial risk, and you may lose the entire amount of your principal investment or more. You should trade or invest only “risk capital” - money you can afford to lose. Trading and investing is not appropriate for everyone. We urge you to conduct your own research and due diligence and obtain professional advice from your personal financial adviser or investment broker before making any investment decision.
OptionsGeek, LLC @2026 All Rights Reserved