
SIGN UP for Trade Ideas, Tools, & Training ↑
THE OPTIONSGEEK FRAMEWORK
What Is Confidence in Options Trading?
In the OptionsGeek Framework developed by Felix Frey, Confidence is an investor-controlled input that represents how strongly the investor believes in a Target Stock Price and how much weight that view receives relative to the market’s distribution of possible outcomes.
A directional investor can have a Target Stock Price and a timeframe, yet still be missing an important part of the investment view.
Suppose two investors both believe a stock trading at $100 could reach $130 within six months. On the surface, their forecasts are identical. But one investor may view $130 as simply a reasonable upside scenario,
while the other may have spent months researching the company and believe there is a very high probability that a specific catalyst will drive the stock toward that level.
The Target Stock Price is the same. The timeframe is the same. The conviction behind the forecast is not.
That creates a problem for any system trying to evaluate which option best expresses the investor’s view. A price target tells the system where the investor thinks the stock can go. It does not tell the system how much weight to place on that expectation.
That is the purpose of Confidence in the OptionsGeek Framework.
The Market Begins With a Distribution of Possible Outcomes
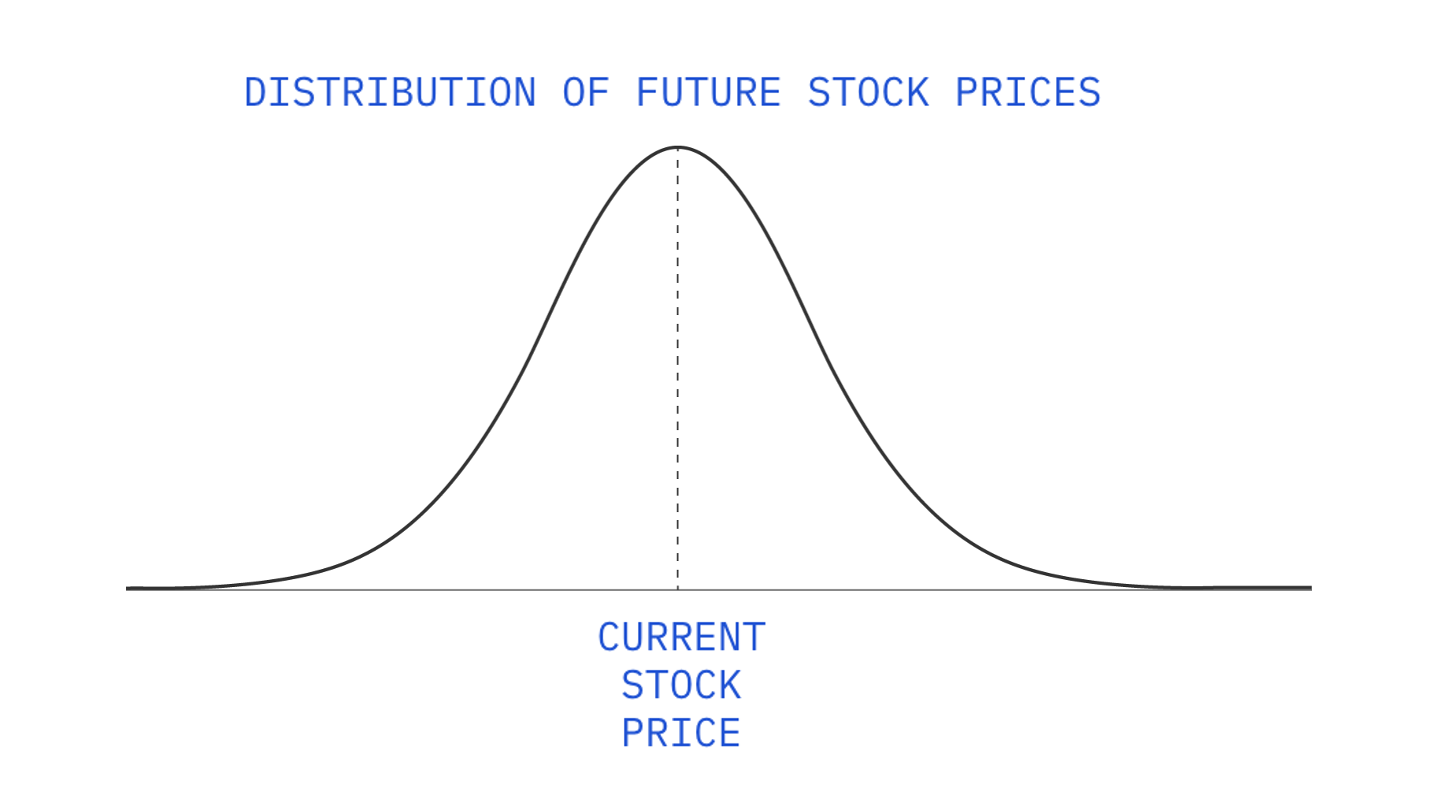
Option pricing does not begin with the assumption that a stock will finish at one specific price. It begins with uncertainty. At expiration, the stock could finish at many different prices. Some outcomes are considered more probable than others, producing a distribution of possible future stock prices. The width of that distribution reflects the uncertainty surrounding the future outcome.
This is an important starting point because the options market must price securities without knowing where the stock will ultimately finish. It therefore incorporates a range of possible outcomes rather than a single directional forecast.
For an investor who has no differentiated view, that distribution provides a logical baseline.
A directional investor, however, is approaching the problem differently.
The Investor Brings a View the Market Does Not Have
A directional investor has done research and formed an opinion about what may happen next. That opinion may include a fundamental thesis, a catalyst, technical evidence, industry developments, or other information the investor believes is important.
The result is a forward-looking expectation.
In the OptionsGeek Framework, two of the clearest expressions of that expectation are the Target Stock Price and Timeframe.
The Target Stock Price says where the investor believes the stock can go. The Timeframe says when the investor expects that move to occur.
But even those two inputs do not fully describe the thesis.
An investor who considers $130 merely plausible should not necessarily evaluate the available options in the same way as an investor who has unusually strong conviction in $130.
Something is still missing.
Confidence Represents the Strength of the Investor's View
Confidence is designed to capture that missing dimension.
Consider the two investors from the previous example:
INVESTOR A
Target Stock Price = $130
Confidence = 3
INVESTOR B
Target Stock Price = $130
Confidence = 9
Both investors have the same Target Stock Price. What differs is how strongly each believes in that outcome.
The Target Stock Price measures the expected destination.
Confidence measures the strength of the investor's belief in that expectation.
These are separate inputs. Confidence does not change where the investor thinks the stock can go. It changes how much weight the framework gives that view.
Once those are treated separately, the next question becomes unavoidable: how can something as subjective as investment conviction be incorporated into a mathematical framework?
Confidence Needs a Mechanism
Investing has always contained a tension between science and art.
The science includes market prices, probabilities, volatility, and mathematical models. The art includes judgment, research, experience, interpretation, and conviction.
Neither can completely replace the other.
A mathematical model can describe what the market is pricing, but it cannot independently know whether an investor has uncovered something the market is missing. Conversely, an investor may have a powerful thesis, but conviction alone does not provide a disciplined method for comparing dozens of options with different strikes, premiums, and payouts.
The challenge is therefore not to eliminate judgment. It is to create a mechanism through which judgment can interact with the mathematics.
The first step is to define the two boundaries that Confidence moves between.
The Two Boundaries Make Confidence Concrete
The easiest way to understand the Confidence mechanism is to begin with its two endpoints.
At the low end of Confidence, the framework stays close to the model's existing distribution of possible future stock prices. The investor is providing a Target Stock Price, but is assigning relatively little additional certainty to that forecast.
At the opposite extreme, imagine the investor had complete certainty.
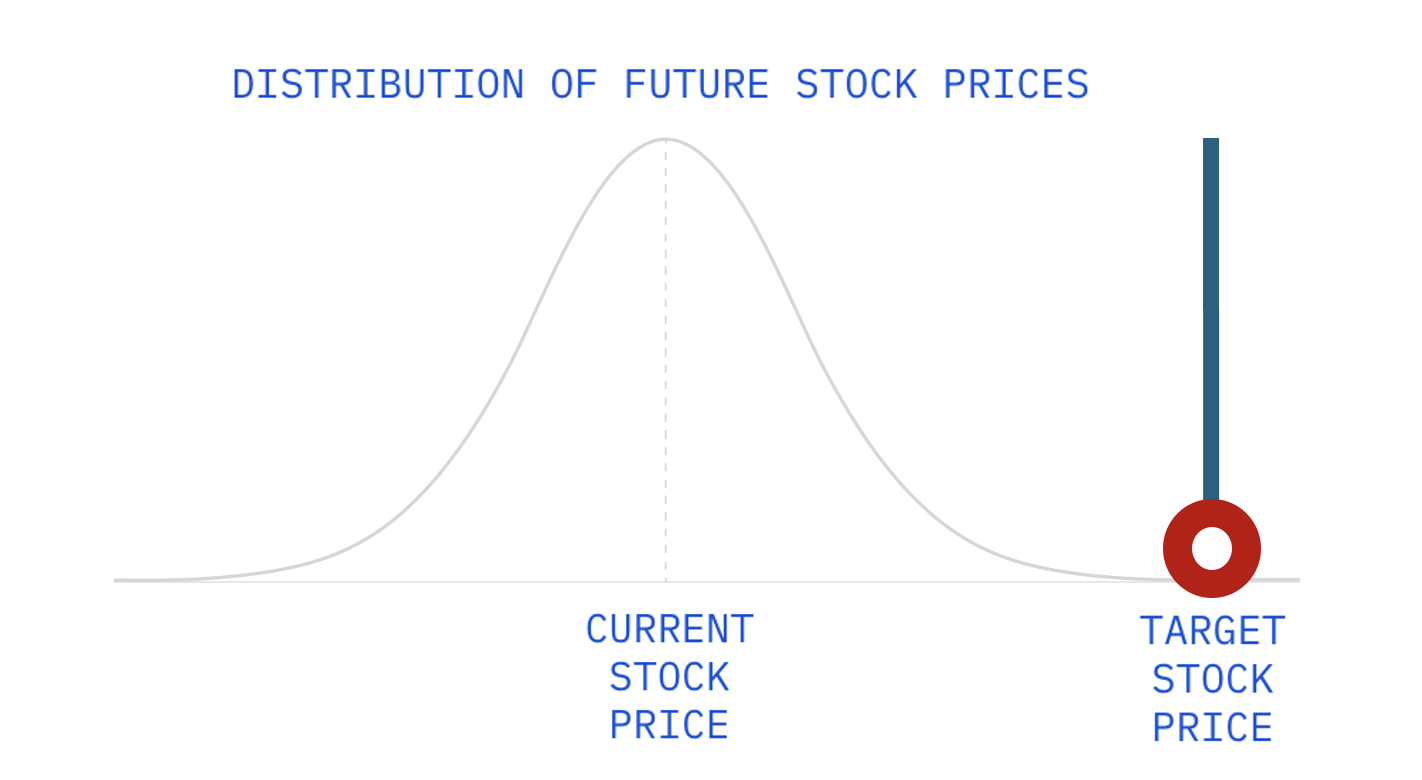
If the investor knew with absolute certainty that the stock would be at the Target Stock Price at the relevant time, there would no longer be a meaningful distribution of possible outcomes. The uncertainty would disappear.
Conceptually, the distribution would continue to narrow until it collapsed into a straight line at the Target Stock Price.
These two endpoints create the boundaries of the Confidence mechanism:
LOW CONFIDENCE
Uses the model’s distribution of possible outcomes.
MAXIMUM CONFIDENCE
Assumes the investor's Target Stock Price is the outcome.
Once those two boundaries are established, the next question is how the investor moves between them.
Confidence on the New Options Chain
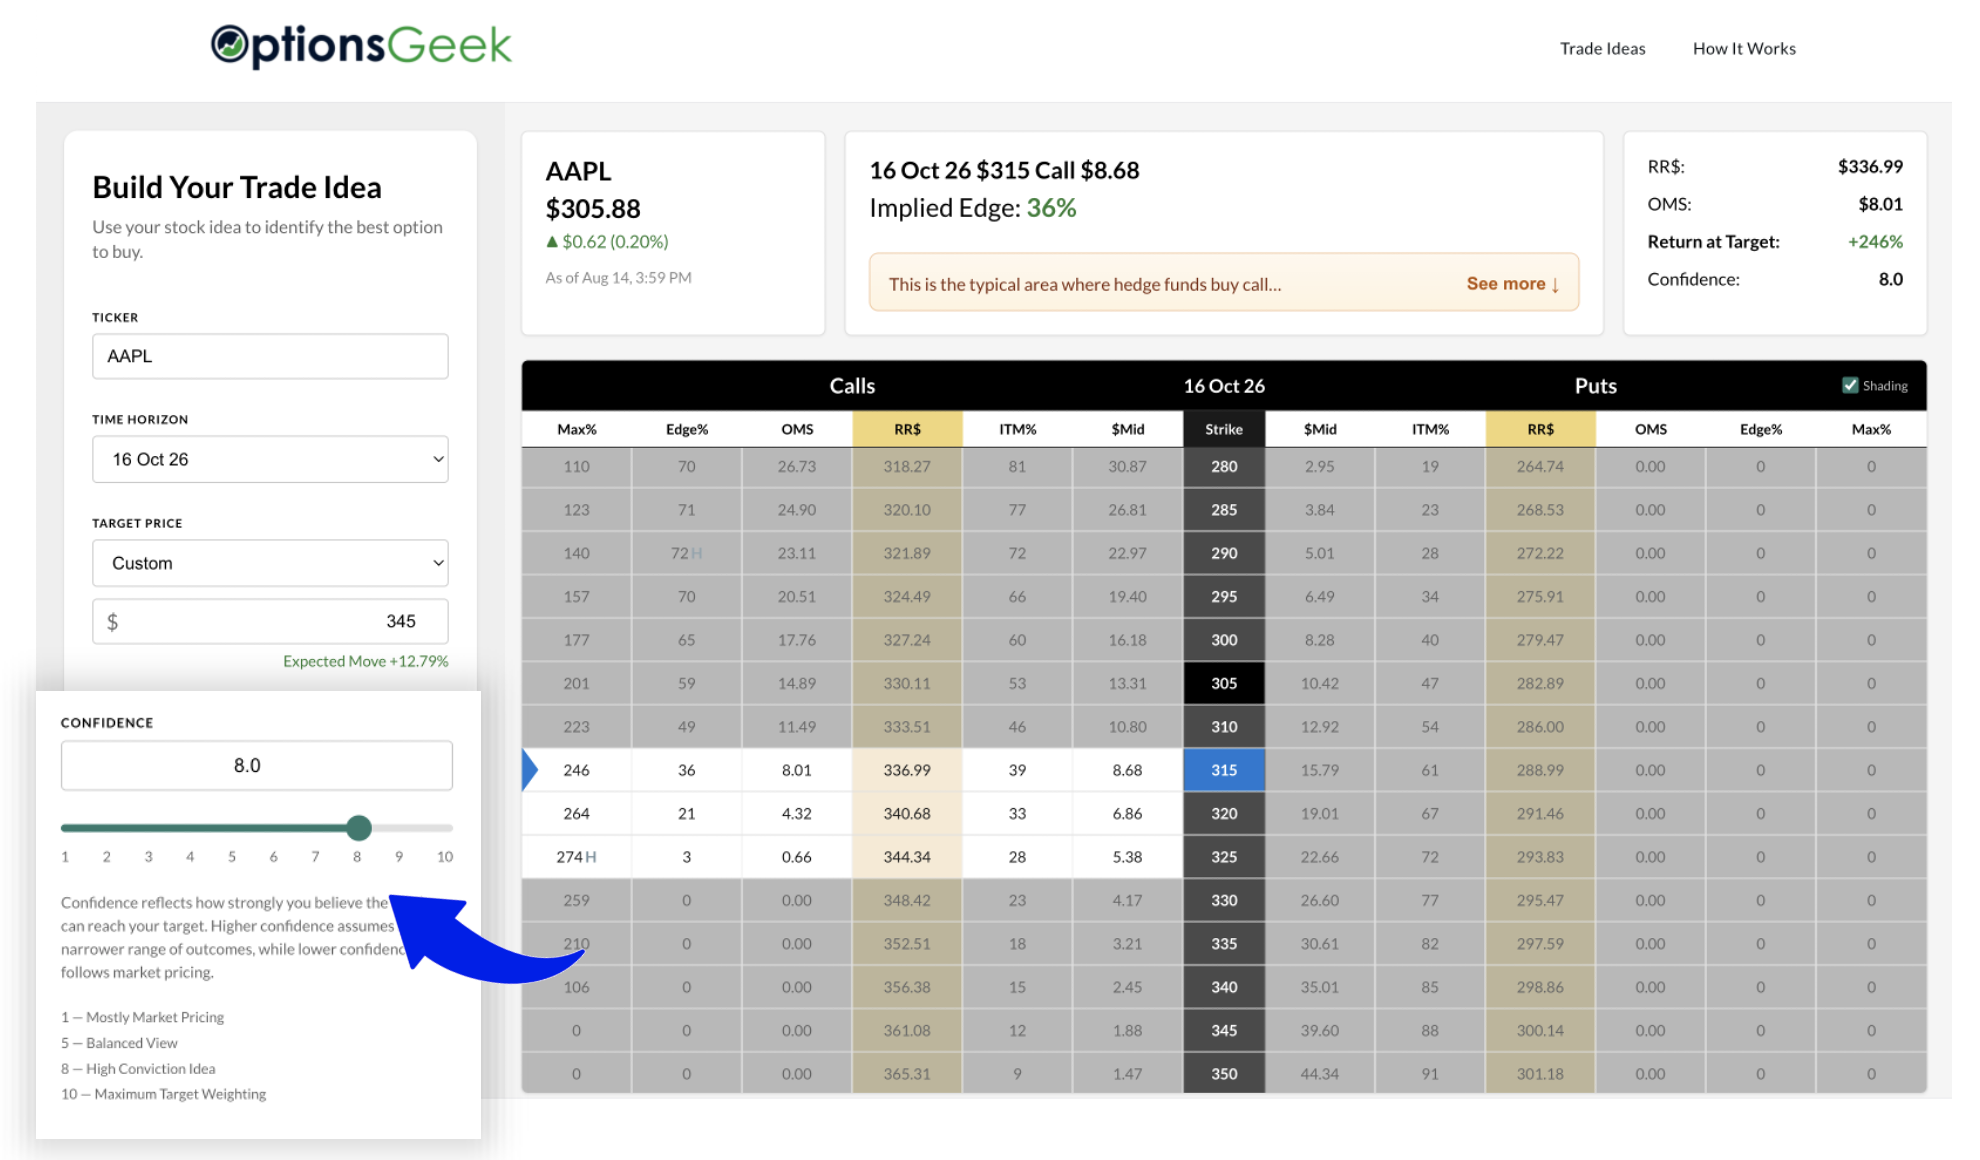
On the New Options Chain above, Confidence is controlled through a horizontal slider ranging from 1 to 10, with 10 representing 100% confidence in the Target Stock Price.
The investor selects the level that best reflects the strength of their conviction in the Target Stock Price.
The slider does not change the investor's target. It changes how strongly that target is reflected in the model's distribution of possible outcomes.
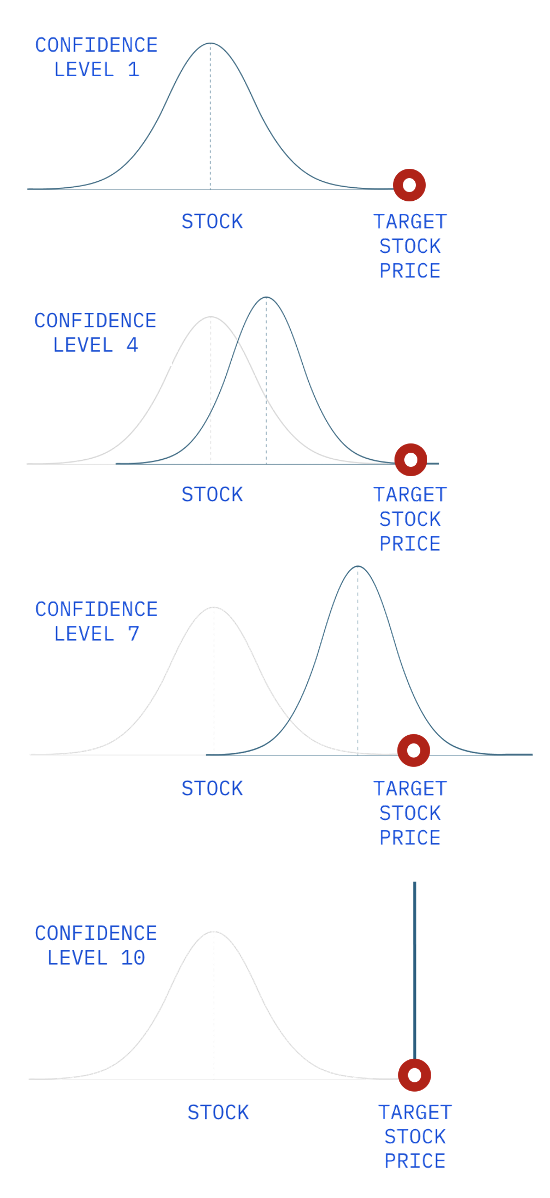
The next diagram illustrates the progression at Confidence Levels 1, 4, 7, and 10.
The gray curve represents the model's original distribution of possible future stock prices, centered around the current stock price.
The blue curve shows how that distribution changes as Confidence increases.
At Level 1, the lowest Confidence setting, the two distributions overlap.
By Levels 4 and 7, the blue distribution has shifted toward the Target Stock Price and become more concentrated around it. Notice how the curve grows taller as it becomes narrower.
At Level 10, representing 100% confidence in the Target Stock Price, the distribution conceptually collapses into a straight line at the Target Stock Price.
With the endpoints now defined and the slider in place, the levels in between represent the progression from one state toward the other.
Confidence Moves Between the Two States
Intermediate Confidence levels progressively move the framework from one boundary toward the other.
As Confidence increases, the distribution shifts from the market’s distribution of possible outcomes toward the investor’s Target Stock Price, becoming more concentrated around that expectation.
The precise mathematical method used to create that progression can be implemented in different ways. What matters conceptually is the function the mechanism performs.
It gives the investor control over how much weight the model places on the market's uncertainty versus the investor's own forecast.
That turns Confidence from a vague statement such as "I feel pretty good about this trade" into an input that can influence the analysis.
And once the distribution changes, the economics of the available options can change with it.
Why Confidence Changes Which Option Looks Attractive
Different options produce different combinations of probability and payout.
Which trade is more attractive depends partly on how much probability the investor assigns to those different outcomes.
Consider the extreme case again.
If the stock were known with certainty to finish at $130, strike selection becomes simple: choose the strike with the highest payout at the $130 Target Stock Price.
Keeping the $130 Target Stock Price unchanged, as Confidence falls, uncertainty returns, and the model must once again balance the payout of each strike against the probability of reaching different outcomes.
The New Options Chain example below shows this happening in practice.
In both screenshots, AAPL is trading at $305.88, the expiration is October 16, 2026, and the Target Stock Price remains $345. The only input that changes is Confidence.
At Confidence 7, the New Options Chain selects the $310 Call. That option offers 49% Implied Edge and a 223% Return at Target.
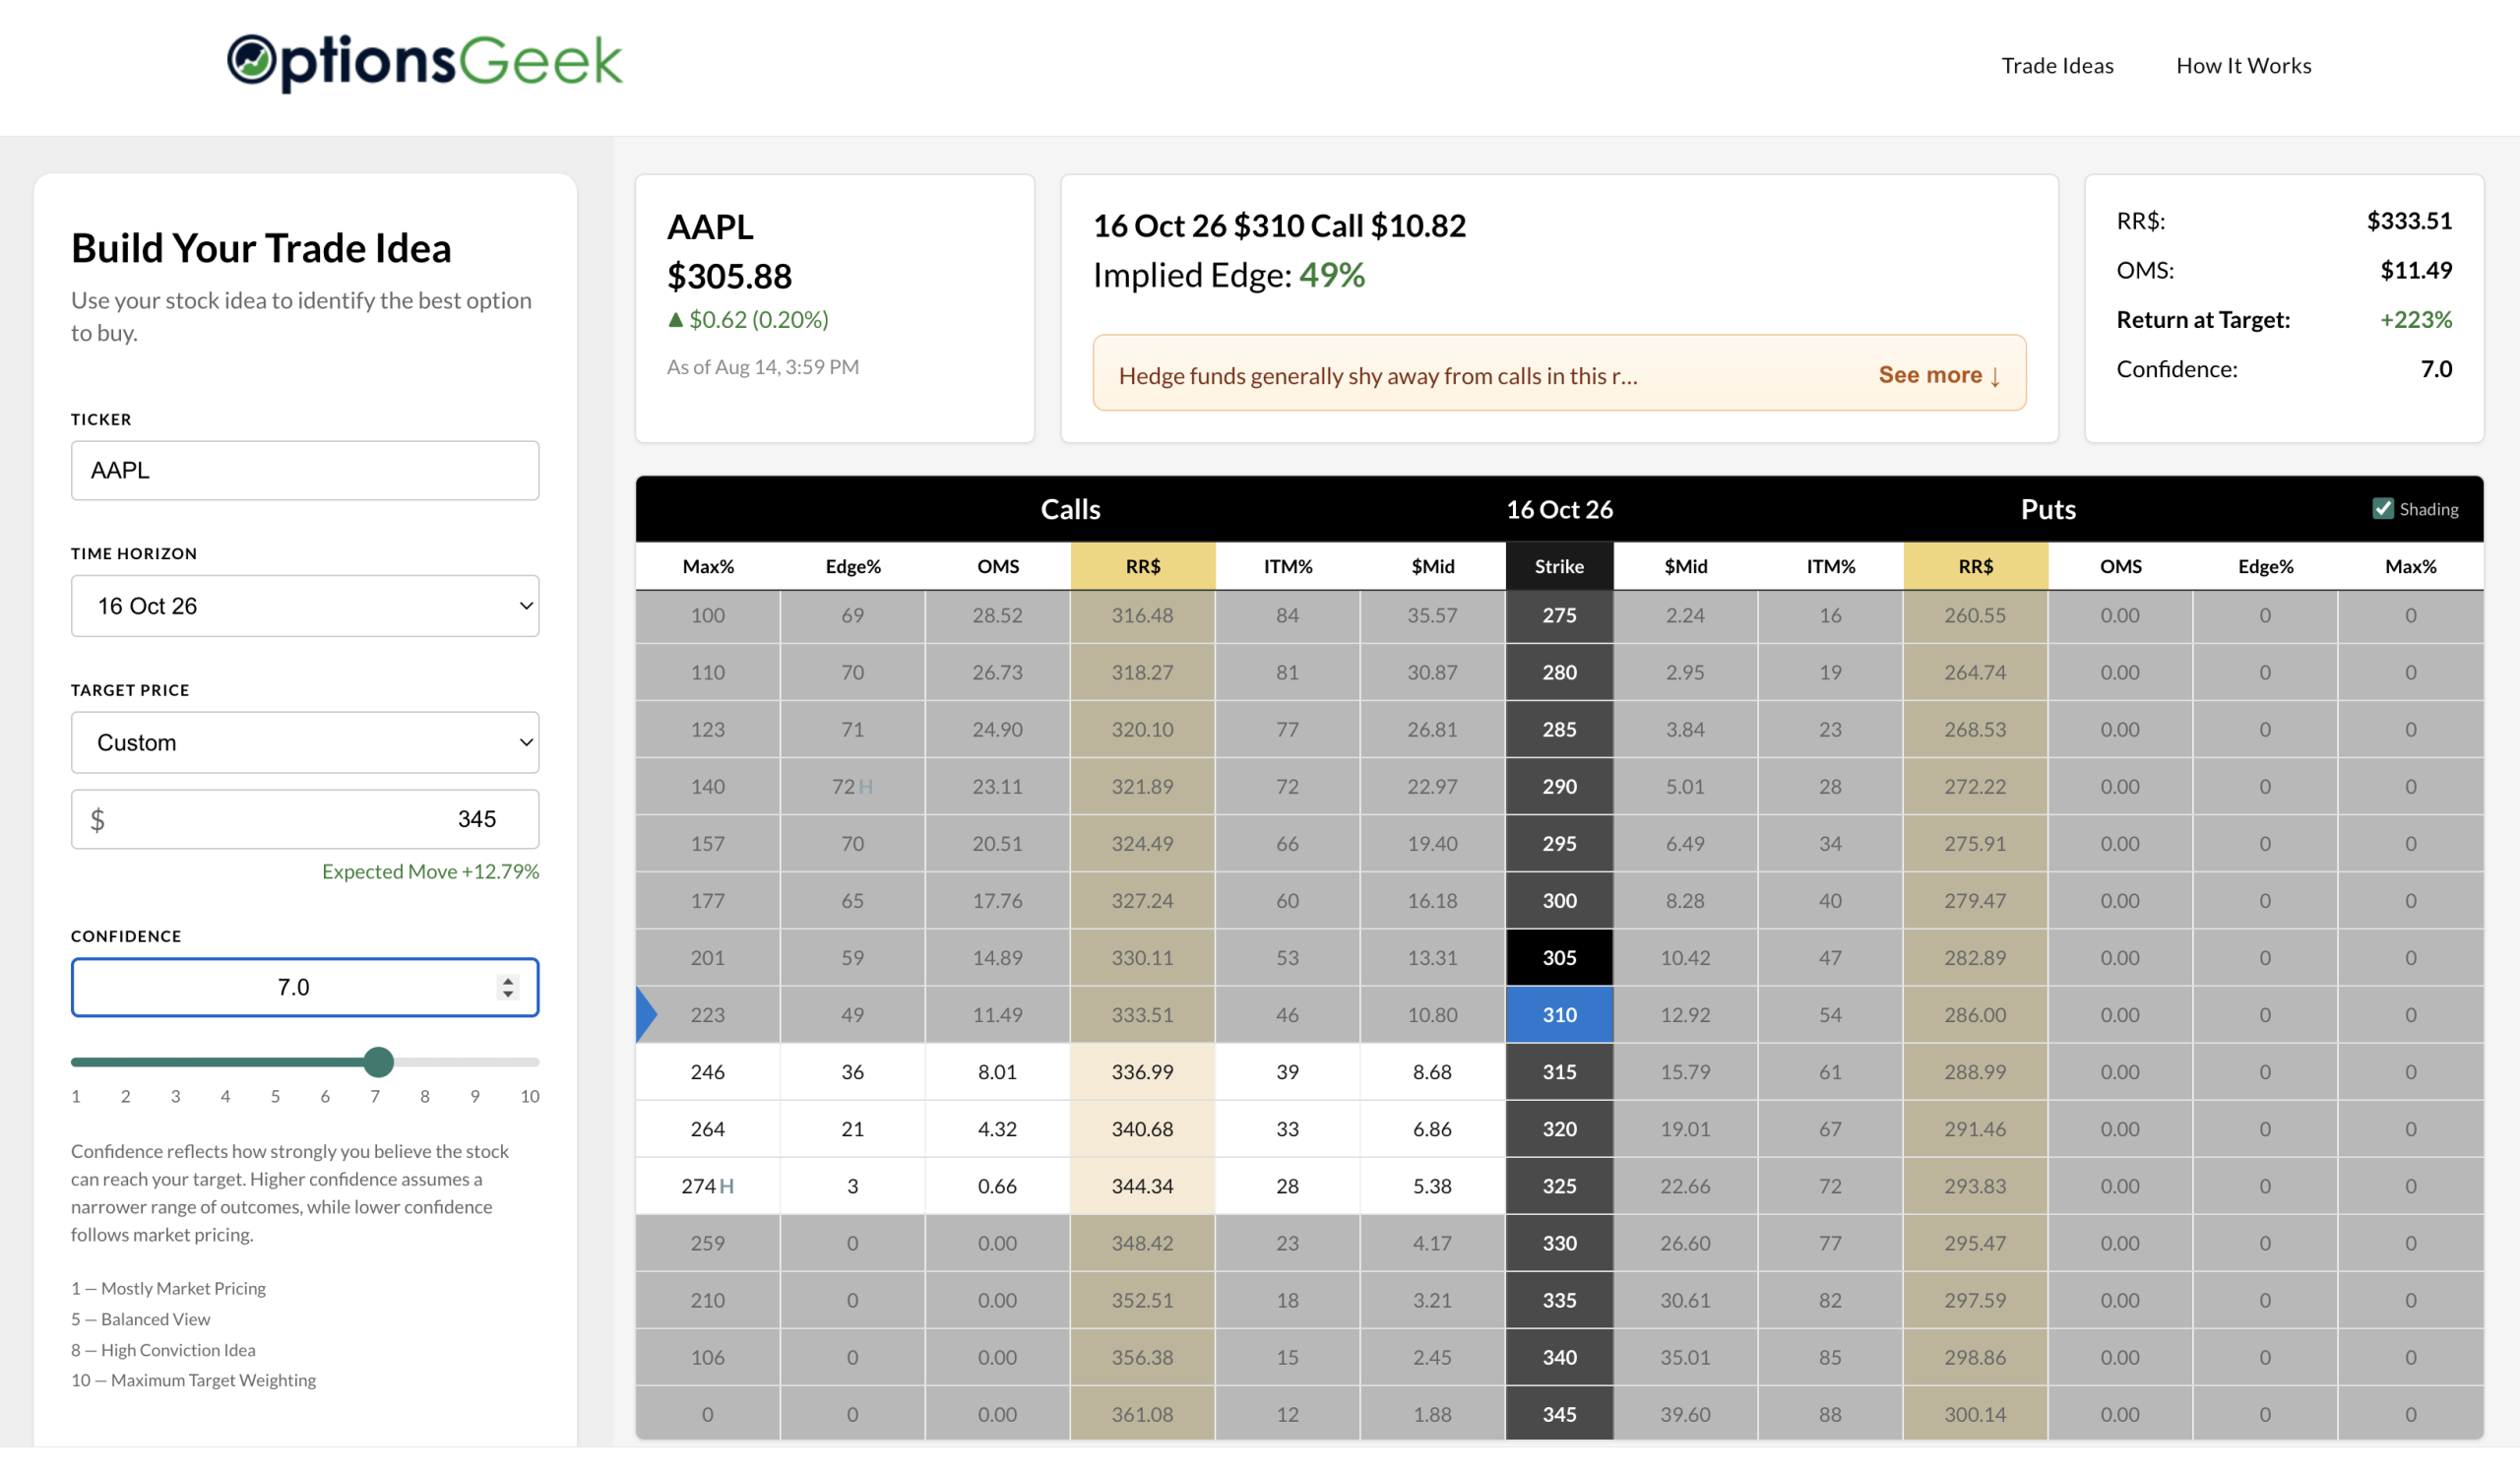
When Confidence increases to 8, the selected strike moves higher to the $315 Call. Implied Edge falls to 36%, while the Return at Target increases to 246%.
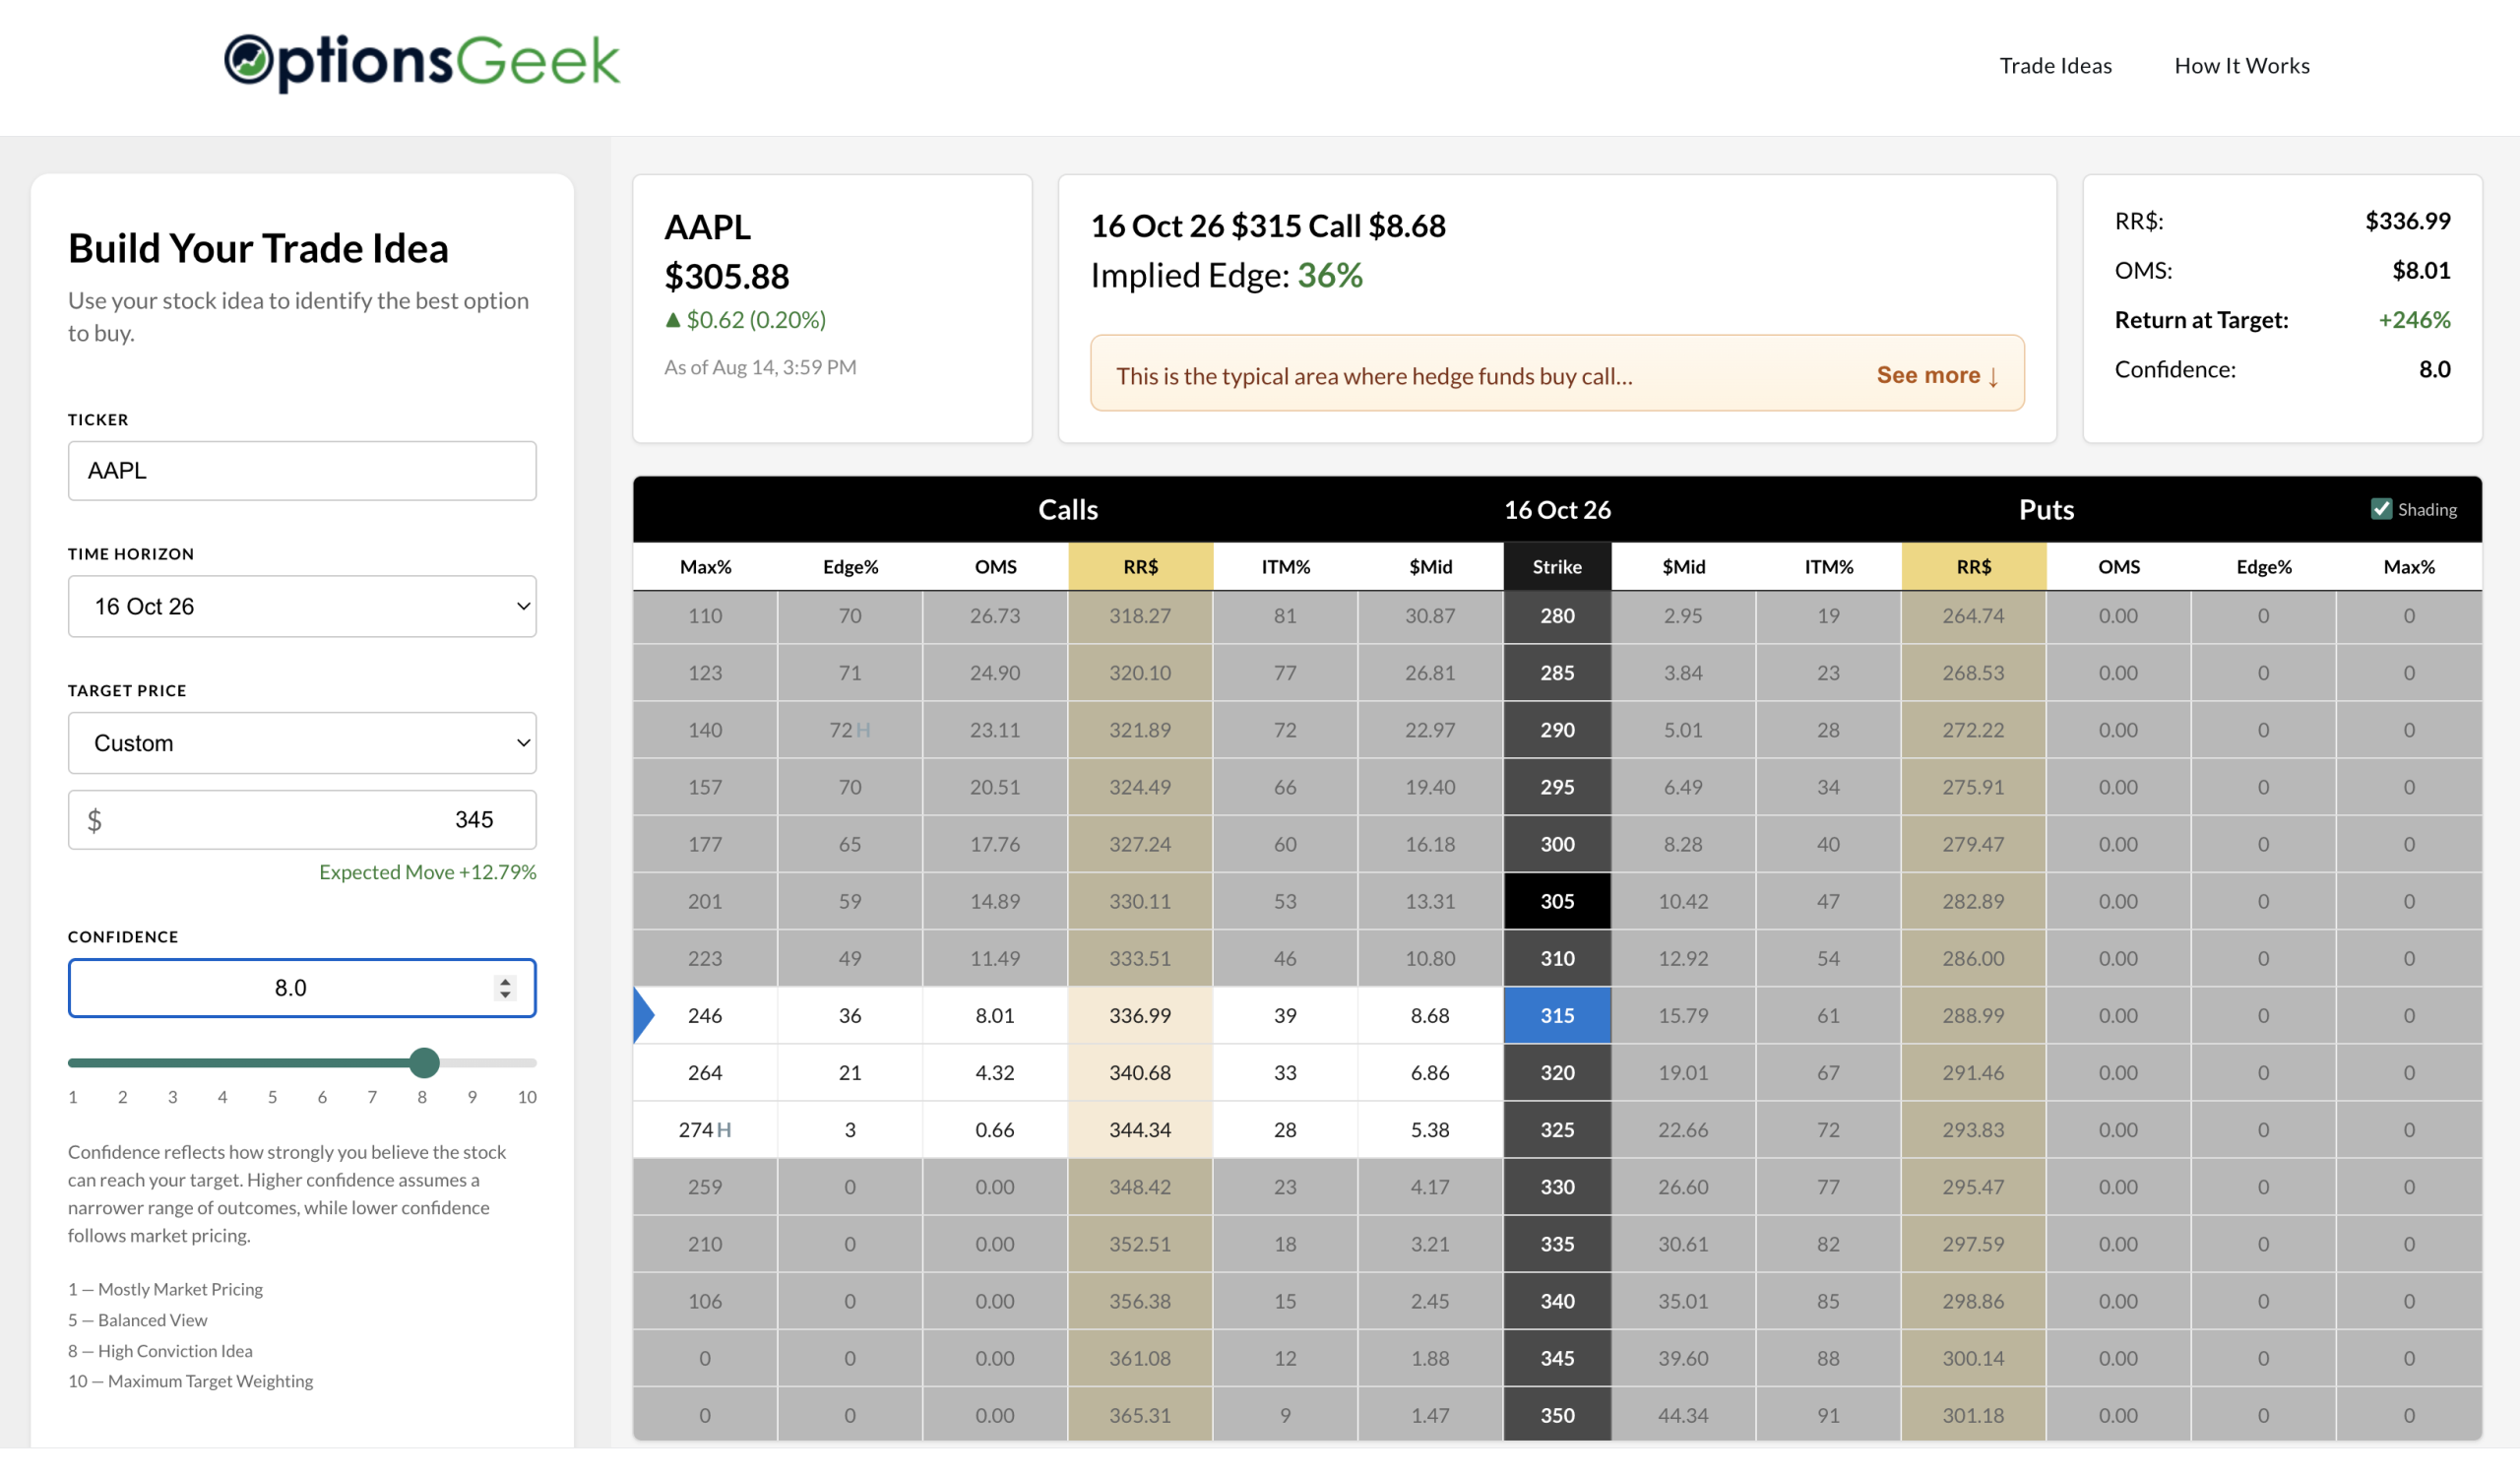
Nothing about the stock idea, Target Stock Price, or timeframe changed. Only the investor's Confidence changed.
With greater Confidence in the $345 target, the model can place more weight on the payout available if that target is reached. With lower Confidence, it places greater weight on the wider range of possible outcomes.
This is why Confidence can affect strike selection.
It changes the assumptions under which probability and payout are balanced.
Confidence Does Not Create Edge
There is an important limitation to the concept.
Increasing the Confidence setting does not make an investment thesis better.
It does not make the Target Stock Price more likely to occur, and it does not turn poor research into good research. If an investor has an unrealistic target and assigns maximum Confidence to it, the framework cannot make the underlying assumption correct.
Confidence is an input supplied by the investor, not a forecast generated by the tool.
This preserves the proper division of responsibility.
The investor is responsible for the thesis, the Target Stock Price, the Timeframe, and the degree of conviction behind those assumptions. The framework is responsible for evaluating what the options market is offering relative to that view.
The better the investor's judgment, the more useful that comparison can become.
Confidence Connects the Art of Investing With the Science of Options
This is the broader reason Confidence exists inside the OptionsGeek Framework.
Options markets are mathematical. Investment theses are not purely mathematical.
An investor may spend weeks studying a company, evaluating management, analyzing an upcoming catalyst, comparing industry trends, and determining what the market may be overlooking. Much of the resulting conviction is difficult to reduce to a single objective statistic.
Yet ignoring that conviction entirely creates another problem. It treats an investor with deep knowledge and a differentiated thesis exactly the same as someone who simply entered a Target Stock Price.
Confidence provides a bridge between those two worlds.
SCIENCE
Market prices
Probability
Volatility
Option Models
←→
CONFIDENCE
←→
ART
Research
Judgment
Experience
Conviction
The Target Stock Price tells the framework what the investor expects.
The Timeframe tells it when the investor expects it.
Confidence tells it how strongly to weight that expectation within the range of possible outcomes.
The option strikes can then be evaluated against that view.
Investing remains a blend of science and art. Confidence does not attempt to eliminate the art.
It gives the art a mechanism through which it can interact with the science.
Explore the OptionsGeek Framework

Information contained in any email and this website maintained by OptionsGeek, LLC (“OptionsGeek”) are provided for educational purposes only and are neither an offer nor a recommendation to buy or sell any security, options on equities or indices, or cryptocurrency. OptionsGeek and its affiliates may hold a position in any of the companies mentioned. OptionsGeek is neither a registered investment adviser nor a broker-dealer and does not provide customized or personalized recommendations. Any one-on-one coaching or similar products or services offered by or through OptionsGeek does not provide or constitute personal advice, does not take into consideration and is not based on the unique or specific needs, objectives or financial circumstances of any person, and is intended for educational purposes only. Past performance is not necessarily indicative of future results. No trading strategy is risk free. Trading and investing involve substantial risk, and you may lose the entire amount of your principal investment or more. You should trade or invest only “risk capital” - money you can afford to lose. Trading and investing are not appropriate for everyone. We urge you to conduct your own research and due diligence and obtain professional advice from your personal financial adviser or investment broker before making any investment decision.
OptionsGeek, LLC @2026 All Rights Reserved